Temperatura, pioggia, sole.
Ottobre in Burundi è in media un mese abbastanza caldo, con una temperatura media di 20,8 gradi. Nella capitale, Gitega, la temperatura media è di 19,9 °C.
Le precipitazioni sono abbondanti, dato che ammontano in media a 120 millimetri, distribuiti in 16 giorni.
Il sole brilla in media per circa 6 ore.
Il giorno, dall'alba al tramonto, dura in media per circa 12 ore.
Temperature medie
Nella mappa seguente possiamo vedere le temperature medie, minime e massime, in Burundi, nel mese di ottobre, in una selezione di località.
Mappa di: ottobre
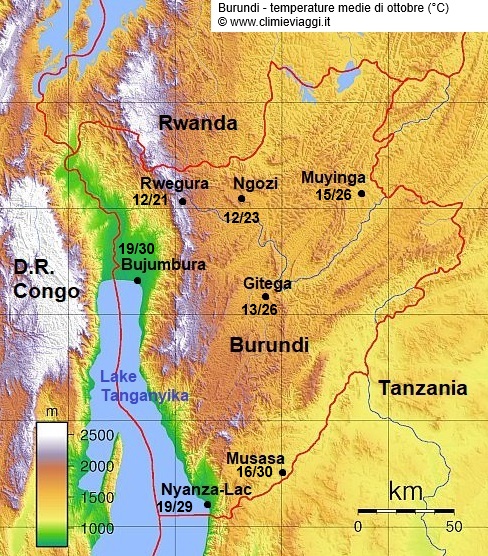 Burundi - temperature medie di ottobre.
Medie climatiche del mese - Ottobre
La tabella seguente mostra le medie climatiche nel mese di ottobre in Burundi. Burundi - Dati climatici a Ottobre| Città | Temperatura
(°C) | Precipit. | Temp.
mare (°C) |
|---|
| Min | Max | Media | mm | giorni | |
|---|
Bujumbura
(800 m.) | 19 | 30 | 24,6 | 60 | 15 | |
|---|
Gitega
(1.700 m.) | 13 | 26 | 19,9 | 100 | 17 | |
|---|
Musasa
(1.285 m.) | 16 | 30 | 23 | 85 | 12 | |
|---|
Muyinga
(1.750 m.) | 15 | 26 | 20,5 | 105 | 16 | |
|---|
Ngozi
(1.840 m.) | 12 | 23 | 17,3 | 125 | 17 | |
|---|
Nyanza-Lac
(880 m.) | 19 | 29 | 24,2 | 105 | 12 | |
|---|
Rwegura
(2.300 m.) | 12 | 21 | 16,2 | 260 | 20 | |
|---|
Media
Ottobre | 15,1 | 26,5 | 20,8 | 120,4 | 15,6 | |
|---|
Quando possibile, i dati fanno riferimento al periodo climatico standard definito dall’Organizzazione Meteorologica Mondiale (OMM), cioè il trentennio 1991-2020.
Scegli un altro mese. Vedi il clima in Burundi nel mese di:
Vedi il clima -
Burundi