Temperatura, pioggia, sole.
Ottobre a Panama è in media un mese caldo, con una temperatura media di 26 gradi. Nella capitale, Panama City, la temperatura media è di 27,1 °C.
Le precipitazioni sono decisamente abbondanti, dato che ammontano in media a 337 millimetri, distribuiti in 19 giorni.
La temperatura del mare è in media di circa 28,5 °C. Dunque, il mare è piacevolmente caldo e consente lunghi bagni.
Il sole brilla in media per circa 5 ore.
Il giorno, dall'alba al tramonto, dura in media per circa 12 ore.
Temperature medie
Nella mappa seguente possiamo vedere le temperature medie, minime e massime, a Panama, nel mese di ottobre, in una selezione di località.
Mappa di: ottobre
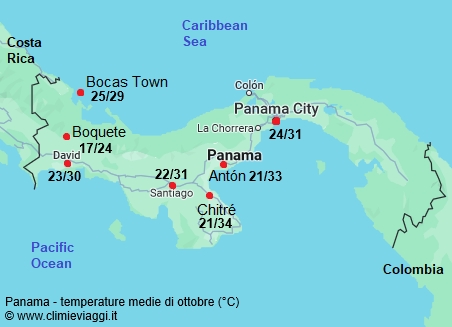 Panama - temperature medie di ottobre.
Medie climatiche del mese - Ottobre
La tabella seguente mostra le medie climatiche nel mese di ottobre a Panama. Panama - Dati climatici a Ottobre| Città | Temperatura
(°C) | Precipit. | Temp.
mare (°C) |
|---|
| Min | Max | Media | mm | giorni | |
|---|
| Anton | 21 | 33 | 27,2 | 255 | 18 | 28 |
|---|
| Bocas Town | 25 | 29 | 27,1 | 215 | | 29 |
|---|
Boquete
(1.200 m.) | 16 | 24 | 20,0 | 525 | 23 | |
|---|
| Chitré | 21 | 34 | 27,5 | 225 | 14 | 28 |
|---|
| David | 23 | 30 | 26,6 | 400 | | |
|---|
| Panama City | 24 | 31 | 27,1 | 330 | 20 | 29 |
|---|
| Santiago | 22 | 31 | 26,7 | 410 | 18 | |
|---|
Media
Ottobre | 21,8 | 30,2 | 26,0 | 337,3 | 18,6 | 28,4 |
|---|
Quando possibile, i dati fanno riferimento al periodo climatico standard definito dall’Organizzazione Meteorologica Mondiale (OMM), cioè il trentennio 1991-2020.
Scegli un altro mese. Vedi il clima a Panama nel mese di:
Vedi il clima -
Panama