Temperatura, pioggia, sole.
Dicembre in Namibia è in media un mese caldo, con una temperatura media di 23,6 gradi. Nella capitale, Windhoek, la temperatura media è di 25,1 °C.
Le precipitazioni sono a livello intermedio, dato che ammontano in media a 44 millimetri, distribuiti in 5 giorni.
La temperatura del mare è in media di circa 16 °C. Dunque, il mare è freddo per fare il bagno.
Il sole brilla in media per circa 8,5 ore.
Il giorno, dall'alba al tramonto, dura in media per circa 13,5 ore.
Temperature medie
Nella mappa seguente possiamo vedere le temperature medie, minime e massime, in Namibia, nel mese di dicembre, in una selezione di località.
Mappa di: dicembre
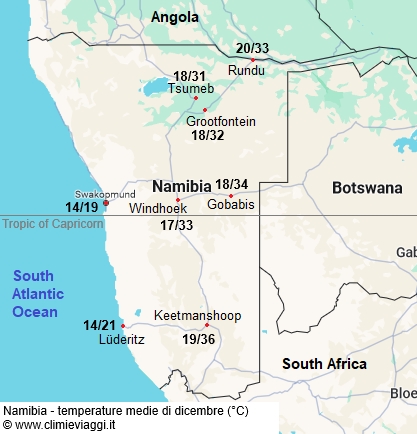 Namibia - temperature medie di dicembre.
Medie climatiche del mese - Dicembre
La tabella seguente mostra le medie climatiche nel mese di dicembre in Namibia. Namibia - Dati climatici a Dicembre| Città | Temperatura
(°C) | Precipit. | Temp.
mare (°C) |
|---|
| Min | Max | Media | mm | giorni | |
|---|
Gobabis
(1.450 m.) | 18 | 34 | 26,2 | 40 | 2 | |
|---|
Grootfontein
(1.400 m.) | 18 | 32 | 25,2 | 80 | 7 | |
|---|
Keetmanshoop
(1.000 m.) | 19 | 36 | 27,4 | 15 | 2 | |
|---|
| Luderitz | 14 | 20 | 17,0 | 0 | 1 | |
|---|
Rundu
(1.100 m.) | 20 | 33 | 26,8 | 80 | 12 | |
|---|
| Swakopmund | 14 | 19 | 16,5 | 0 | 0 | 16 |
|---|
Tsumeb
(1.330 m.) | 18 | 31 | 24,5 | 95 | 11 | |
|---|
Windhoek
(1.700 m.) | 17 | 33 | 25,1 | 40 | 8 | |
|---|
Media
Dicembre | 17,2 | 29,9 | 23,6 | 43,5 | 5,4 | 16 |
|---|
Quando possibile, i dati fanno riferimento al periodo climatico standard definito dall’Organizzazione Meteorologica Mondiale (OMM), cioè il trentennio 1991-2020.
Scegli un altro mese. Vedi il clima in Namibia nel mese di:
Vedi il clima -
Namibia