Temperatura, pioggia, sole.
Novembre in Namibia è in media un mese caldo, con una temperatura media di 23 gradi. Nella capitale, Windhoek, la temperatura media è di 24,3 °C.
Le precipitazioni sono abbastanza rare, dato che ammontano in media a 32 millimetri, distribuiti in 4 giorni.
La temperatura del mare è in media di circa 15 °C. Dunque, il mare è freddo per fare il bagno.
Il sole brilla in media per circa 9 ore.
Il giorno, dall'alba al tramonto, dura in media per circa 13 ore.
Temperature medie
Nella mappa seguente possiamo vedere le temperature medie, minime e massime, in Namibia, nel mese di novembre, in una selezione di località.
Mappa di: novembre
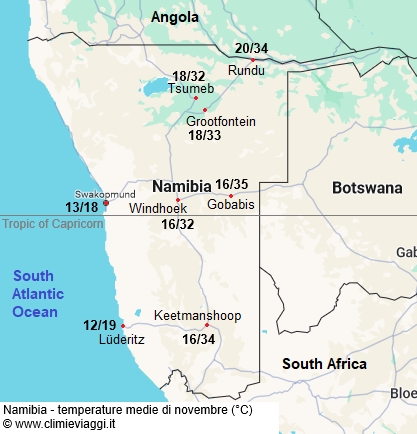 Namibia - temperature medie di novembre.
Medie climatiche del mese - Novembre
La tabella seguente mostra le medie climatiche nel mese di novembre in Namibia. Namibia - Dati climatici a Novembre| Città | Temperatura
(°C) | Precipit. | Temp.
mare (°C) |
|---|
| Min | Max | Media | mm | giorni | |
|---|
Gobabis
(1.450 m.) | 16 | 35 | 25,5 | 40 | 1 | |
|---|
Grootfontein
(1.400 m.) | 18 | 33 | 25,3 | 60 | 5 | |
|---|
Keetmanshoop
(1.000 m.) | 16 | 34 | 25,2 | 10 | 2 | |
|---|
| Luderitz | 12 | 19 | 15,8 | 0 | 0 | |
|---|
Rundu
(1.100 m.) | 20 | 34 | 27,3 | 60 | 9 | |
|---|
| Swakopmund | 13 | 18 | 15,5 | 0 | 0 | 15 |
|---|
Tsumeb
(1.330 m.) | 18 | 32 | 25 | 55 | 6 | |
|---|
Windhoek
(1.700 m.) | 16 | 32 | 24,3 | 25 | 5 | |
|---|
Media
Novembre | 16,2 | 29,7 | 23,0 | 31,5 | 3,5 | 15 |
|---|
Quando possibile, i dati fanno riferimento al periodo climatico standard definito dall’Organizzazione Meteorologica Mondiale (OMM), cioè il trentennio 1991-2020.
Scegli un altro mese. Vedi il clima in Namibia nel mese di:
Vedi il clima -
Namibia