Stagioni, regioni, periodo migliore, medie climatiche
Indice
Il clima in breve
Il clima della Gran Bretagna, influenzato dall'Oceano Atlantico, è temperato e umido, con scarti di temperatura relativamente contenuti tra l'inverno e l'estate. Il tempo è però variabile, con frequenti cambiamenti da un giorno all'altro o anche nell'arco della stessa giornata.
La Gran Bretagna è un'isola dell'Europa occidentale, e amministrativamente è divisa in Inghilterra, Scozia e Galles. Insieme all'Irlanda del Nord forma il Regno Unito di Gran Bretagna e Irlanda del Nord. La capitale è Londra.

Le temperature medie in pianura sono sempre superiori allo zero anche in gennaio, quando oscillano intorno ai 4/5 °C nelle città principali, e arrivano a 6 gradi nella punta sudoccidentale del Paese. A luglio oscillano tra i 12 gradi del nord della Scozia e i 19 °C nella regione di Londra.
Ecco l'andamento delle temperature.
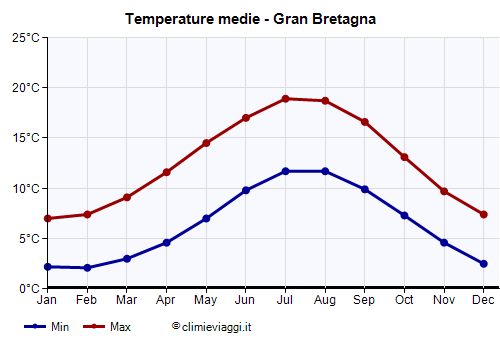 Gran Bretagna - Temperature medie mensili (minime notturne e massime diurne).
Le precipitazioni sono ovunque frequenti, ma sono ancor più frequenti e abbondanti al nord e sui versanti occidentali. Ad esempio in Scozia occidentale si raggiungono i 1.500 millimetri, con circa 200 giorni all'anno di pioggia (più di un giorno su due!), mentre a Manchester, nell'Inghilterra occidentale, cadono 800 mm di pioggia in 141 giorni; a Plymouth, sulla costa sudoccidentale, cadono 1.000 mm di pioggia in 142 giorni. Il sud-est è meno piovoso: a Londra cadono appena 615 mm di pioggia l'anno, distribuiti comunque in 111 giorni.
Quando andare
Il periodo migliore per visitare la Gran Bretagna è l'estate, da giugno ad agosto: è una stagione molto fresca in Scozia, e progressivamente più calda man mano che si procede verso sud; è ovunque abbastanza piovosa ma anche relativamente soleggiata.
In tutta la Gran Bretagna, giugno è un buon mese: le giornate sono molto lunghe, il paese è in fiore, le piogge e le nubi non mancano, ma esse si alternano al sole. Anche maggio (che però al nord e in Scozia è molto fresco, e a volte persino freddo), offre spesso un tempo discreto.
L'estate piena (luglio-agosto) al centro-sud è piacevolmente calda, e tra un rovescio e l'altro può anche spuntare il sole. A volte ci possono essere brevi ondate di caldo, nelle zone interne dell'Inghilterra centro-meridionale, con massime di 30 °C o più.
Nella Scozia settentrionale e occidentale (v. le isole e Glasgow), in luglio e agosto si registra un aumento delle precipitazioni e una diminuzione del soleggiamento: qui il mese più soleggiato è giugno, che però è anche più fresco rispetto ai due mesi centrali dell'estate.
Il mare è freddo anche in estate: la temperatura dell'Atlantico raggiunge appena i 12 gradi nelle Shetland, i 13/14 °C in Scozia, i 17 °C nella Manica e in Cornovaglia.
Non essendo il clima della Gran Bretagna caratterizzato da estremi climatici, non esiste una stagione da evitare assolutamente, anche se va detto che da novembre a gennaio le giornate sono molto corte e il cielo è spesso grigio o nuvoloso, inoltre, in inverno, da dicembre a febbraio, ma a volte anche a novembre e marzo, ci possono essere periodi freddi, con nevicate e gelate.
In valigia - cosa portare
In inverno: vestiti caldi, maglione, cappotto, impermeabile. Per la Scozia e per le highlands, e per i periodi più freddi: guanti, berretto, sciarpa.
In estate: vestiti di mezza stagione, giacca e felpa, impermeabile o ombrello. Nella zona di Londra è più facile che in alcune giornate ci si possa vestire leggeri, con t-shirt e pantaloncini.
Medie climatiche - Gran Bretagna
Nelle seguenti località:
Belfast
Belfast, posizione nella mappa
Belfast - medie climatiche| Mese | Gen | Feb | Mar | Apr | Mag | Giu | Lug | Ago | Set | Ott | Nov | Dic | Anno |
|---|
| Temp.min | 2 | 2 | 3 | 5 | 7 | 10 | 12 | 12 | 10 | 7 | 4 | 2 | 6,4 |
|---|
| Temp.max | 7 | 8 | 10 | 12 | 15 | 18 | 19 | 19 | 17 | 13 | 10 | 8 | 12,9 |
|---|
| Prec.(mm) | 90 | 65 | 75 | 65 | 65 | 70 | 65 | 85 | 75 | 95 | 95 | 90 | 935 |
|---|
| Prec. giorni | 15 | 12 | 14 | 11 | 12 | 11 | 11 | 13 | 12 | 14 | 15 | 14 | 154 |
|---|
| Umidità | 84% | 81% | 78% | 74% | 72% | 73% | 75% | 77% | 79% | 81% | 84% | 85% | 79% |
|---|
| Lungh. giorno | 8 | 10 | 12 | 14 | 16 | 17 | 17 | 15 | 13 | 10 | 8 | 7 | 12,3 |
|---|
| Ore sole | 1 | 2 | 3 | 5 | 6 | 5 | 5 | 5 | 4 | 3 | 2 | 1 | 1280 |
|---|
| Temp. mare | 8 | 7 | 7 | 8 | 10 | 12 | 14 | 15 | 15 | 14 | 12 | 10 | 11 |
|---|
Torna alle medie climatiche
Brighton
Brighton, posizione nella mappa
Brighton - medie climatiche| Mese | Gen | Feb | Mar | Apr | Mag | Giu | Lug | Ago | Set | Ott | Nov | Dic | Anno |
|---|
| Temp.min | 3 | 3 | 4 | 6 | 9 | 12 | 14 | 14 | 11 | 9 | 6 | 3 | 7,6 |
|---|
| Temp.max | 8 | 8 | 10 | 13 | 16 | 19 | 21 | 21 | 19 | 15 | 11 | 9 | 14,2 |
|---|
| Prec.(mm) | 90 | 60 | 70 | 55 | 55 | 60 | 50 | 60 | 75 | 95 | 100 | 90 | 860 |
|---|
| Prec. giorni | 18 | 14 | 15 | 14 | 13 | 11 | 10 | 12 | 12 | 14 | 16 | 17 | 166 |
|---|
| Umidità | 87% | 84% | 81% | 79% | 78% | 80% | 80% | 79% | 81% | 83% | 86% | 87% | 82% |
|---|
| Lungh. giorno | 8 | 10 | 12 | 14 | 16 | 16 | 16 | 14 | 13 | 11 | 9 | 8 | 12,2 |
|---|
| Ore sole | 2 | 3 | 4 | 6 | 8 | 8 | 8 | 7 | 6 | 4 | 3 | 2 | 1840 |
|---|
| Temp. mare | 9 | 8 | 8 | 9 | 11 | 14 | 16 | 17 | 17 | 16 | 14 | 11 | 12,5 |
|---|
Torna alle medie climatiche
Bristol
Bristol, posizione nella mappa
Bristol - medie climatiche| Mese | Gen | Feb | Mar | Apr | Mag | Giu | Lug | Ago | Set | Ott | Nov | Dic | Anno |
|---|
| Temp.min | 2 | 2 | 4 | 6 | 8 | 11 | 13 | 13 | 11 | 8 | 5 | 3 | 7,3 |
|---|
| Temp.max | 8 | 8 | 11 | 14 | 17 | 20 | 22 | 21 | 19 | 15 | 11 | 8 | 14,5 |
|---|
| Prec.(mm) | 80 | 60 | 55 | 50 | 60 | 55 | 60 | 75 | 65 | 85 | 90 | 90 | 825 |
|---|
| Prec. giorni | 13 | 10 | 10 | 10 | 10 | 10 | 10 | 11 | 10 | 13 | 15 | 13 | 135 |
|---|
| Lungh. giorno | 8 | 10 | 12 | 14 | 16 | 17 | 16 | 14 | 13 | 11 | 9 | 8 | 12,3 |
|---|
| Ore sole | 2 | 3 | 4 | 6 | 7 | 7 | 7 | 6 | 5 | 3 | 2 | 2 | 1660 |
|---|
| Temp. mare | 10 | 9 | 9 | 10 | 11 | 13 | 15 | 16 | 16 | 15 | 13 | 12 | 12,5 |
|---|
Torna alle medie climatiche
Cairn Gorm (1.245 m.)
Cairn Gorm, posizione nella mappa
Cairn Gorm - medie climatiche| Mese | Gen | Feb | Mar | Apr | Mag | Giu | Lug | Ago | Set | Ott | Nov | Dic | Anno |
|---|
| Temp.min | -5 | -5 | -4 | -2 | 0 | 2 | 5 | 4 | 3 | 0 | -3 | -5 | -0,9 |
|---|
| Temp.max | -1 | -1 | 0 | 2 | 5 | 8 | 9 | 9 | 7 | 4 | 1 | 0 | 3,6 |
|---|
Torna alle medie climatiche
Cambridge
Cambridge, posizione nella mappa
Cambridge - medie climatiche| Mese | Gen | Feb | Mar | Apr | Mag | Giu | Lug | Ago | Set | Ott | Nov | Dic | Anno |
|---|
| Temp.min | 2 | 2 | 3 | 5 | 8 | 10 | 13 | 12 | 10 | 7 | 4 | 2 | 6,5 |
|---|
| Temp.max | 8 | 9 | 11 | 15 | 18 | 21 | 23 | 23 | 20 | 15 | 11 | 8 | 15,1 |
|---|
| Prec.(mm) | 45 | 35 | 40 | 40 | 45 | 50 | 50 | 55 | 55 | 60 | 55 | 45 | 575 |
|---|
| Prec. giorni | 11 | 8 | 10 | 9 | 8 | 9 | 8 | 8 | 8 | 10 | 10 | 10 | 109 |
|---|
| Umidità | 86% | 81% | 75% | 70% | 69% | 67% | 66% | 66% | 72% | 79% | 85% | 87% | 75% |
|---|
| Lungh. giorno | 8 | 10 | 12 | 14 | 16 | 17 | 16 | 15 | 13 | 11 | 9 | 8 | 12,3 |
|---|
| Ore sole | 2 | 3 | 4 | 5 | 6 | 6 | 6 | 6 | 5 | 4 | 2 | 2 | 1525 |
|---|
Torna alle medie climatiche
Derry
Derry, posizione nella mappa
Derry - medie climatiche| Mese | Gen | Feb | Mar | Apr | Mag | Giu | Lug | Ago | Set | Ott | Nov | Dic | Anno |
|---|
| Temp.min | 3 | 2 | 4 | 5 | 7 | 10 | 12 | 12 | 10 | 7 | 5 | 3 | 6,6 |
|---|
| Temp.max | 8 | 9 | 10 | 12 | 15 | 17 | 19 | 19 | 17 | 14 | 10 | 8 | 13,3 |
|---|
| Prec.(mm) | 85 | 70 | 60 | 55 | 55 | 60 | 70 | 75 | 60 | 85 | 90 | 95 | 860 |
|---|
| Prec. giorni | 17 | 14 | 14 | 12 | 13 | 12 | 14 | 14 | 14 | 16 | 18 | 17 | 175 |
|---|
| Lungh. giorno | 8 | 10 | 12 | 14 | 16 | 17 | 17 | 15 | 13 | 10 | 8 | 7 | 12,3 |
|---|
| Ore sole | 2 | 3 | 3 | 5 | 7 | 5 | 5 | 5 | 4 | 3 | 2 | 1 | 1360 |
|---|
| Temp. mare | 9 | 9 | 9 | 9 | 10 | 12 | 14 | 15 | 14 | 13 | 12 | 10 | 11,4 |
|---|
Torna alle medie climatiche
Edimburgo
Edimburgo, posizione nella mappa
Edimburgo - medie climatiche| Mese | Gen | Feb | Mar | Apr | Mag | Giu | Lug | Ago | Set | Ott | Nov | Dic | Anno |
|---|
| Temp.min | 1 | 1 | 2 | 4 | 6 | 9 | 11 | 10 | 9 | 6 | 3 | 1 | 5,2 |
|---|
| Temp.max | 7 | 8 | 9 | 12 | 15 | 17 | 19 | 19 | 17 | 13 | 10 | 7 | 12,6 |
|---|
| Prec.(mm) | 65 | 55 | 50 | 40 | 50 | 65 | 70 | 70 | 55 | 75 | 65 | 65 | 725 |
|---|
| Prec. giorni | 12 | 10 | 10 | 9 | 10 | 10 | 11 | 10 | 10 | 12 | 12 | 12 | 128 |
|---|
| Umidità | 85% | 82% | 79% | 77% | 76% | 78% | 79% | 80% | 81% | 83% | 85% | 86% | 81% |
|---|
| Lungh. giorno | 8 | 10 | 12 | 14 | 16 | 18 | 17 | 15 | 13 | 10 | 8 | 7 | 12,3 |
|---|
| Ore sole | 2 | 3 | 4 | 5 | 6 | 5 | 5 | 5 | 4 | 3 | 2 | 2 | 1450 |
|---|
| Temp. mare | 8 | 7 | 7 | 8 | 10 | 12 | 14 | 15 | 14 | 13 | 12 | 10 | 10,8 |
|---|
Torna alle medie climatiche
Glasgow
Glasgow, posizione nella mappa
Glasgow - medie climatiche| Mese | Gen | Feb | Mar | Apr | Mag | Giu | Lug | Ago | Set | Ott | Nov | Dic | Anno |
|---|
| Temp.min | 1 | 1 | 2 | 4 | 6 | 9 | 11 | 10 | 9 | 6 | 3 | 1 | 5,3 |
|---|
| Temp.max | 7 | 8 | 9 | 12 | 15 | 18 | 19 | 19 | 17 | 13 | 10 | 7 | 12,8 |
|---|
| Prec.(mm) | 155 | 125 | 110 | 75 | 70 | 80 | 90 | 105 | 110 | 135 | 145 | 160 | 1360 |
|---|
| Prec. giorni | 18 | 15 | 15 | 13 | 12 | 13 | 13 | 14 | 14 | 17 | 18 | 18 | 180 |
|---|
| Umidità | 86% | 83% | 80% | 76% | 74% | 76% | 78% | 80% | 82% | 85% | 86% | 88% | 81% |
|---|
| Lungh. giorno | 8 | 10 | 12 | 14 | 16 | 18 | 17 | 15 | 13 | 10 | 8 | 7 | 12,3 |
|---|
| Ore sole | 1 | 3 | 3 | 5 | 6 | 5 | 5 | 5 | 4 | 3 | 2 | 1 | 1345 |
|---|
| Temp. mare | 8 | 7 | 7 | 8 | 10 | 12 | 14 | 15 | 14 | 14 | 12 | 10 | 10,8 |
|---|
Torna alle medie climatiche
Glen Ogle (565 m.)
Glen Ogle, posizione nella mappa
Glen Ogle - medie climatiche| Mese | Gen | Feb | Mar | Apr | Mag | Giu | Lug | Ago | Set | Ott | Nov | Dic | Anno |
|---|
| Temp.min | -1 | -1 | 0 | 1 | 4 | 6 | 8 | 8 | 7 | 4 | 1 | 0 | 3,1 |
|---|
| Temp.max | 3 | 3 | 4 | 7 | 10 | 14 | 15 | 14 | 12 | 8 | 5 | 4 | 8,3 |
|---|
Torna alle medie climatiche
Guernsey
Guernsey, posizione nella mappa
Guernsey - medie climatiche| Mese | Gen | Feb | Mar | Apr | Mag | Giu | Lug | Ago | Set | Ott | Nov | Dic | Anno |
|---|
| Temp.min | 5 | 5 | 6 | 7 | 9 | 12 | 14 | 14 | 13 | 11 | 8 | 6 | 9,2 |
|---|
| Temp.max | 9 | 9 | 10 | 12 | 15 | 18 | 20 | 20 | 18 | 15 | 12 | 10 | 14 |
|---|
| Prec.(mm) | 95 | 70 | 65 | 55 | 50 | 45 | 40 | 50 | 60 | 95 | 105 | 115 | 845 |
|---|
| Prec. giorni | 15 | 11 | 12 | 10 | 9 | 7 | 8 | 8 | 9 | 13 | 15 | 16 | 133 |
|---|
| Umidità | 84% | 83% | 83% | 82% | 82% | 83% | 83% | 84% | 82% | 82% | 82% | 83% | 83% |
|---|
| Lungh. giorno | 9 | 10 | 12 | 14 | 15 | 16 | 16 | 14 | 12 | 11 | 9 | 8 | 12,2 |
|---|
| Ore sole | 2 | 3 | 4 | 6 | 8 | 8 | 8 | 7 | 6 | 4 | 3 | 2 | 1865 |
|---|
| Temp. mare | 10 | 9 | 9 | 10 | 12 | 14 | 17 | 18 | 17 | 15 | 13 | 12 | 13 |
|---|
Torna alle medie climatiche
Inverness
Inverness, posizione nella mappa
Inverness - medie climatiche| Mese | Gen | Feb | Mar | Apr | Mag | Giu | Lug | Ago | Set | Ott | Nov | Dic | Anno |
|---|
| Temp.min | 1 | 1 | 2 | 3 | 6 | 9 | 11 | 10 | 8 | 5 | 3 | 0 | 4,9 |
|---|
| Temp.max | 6 | 7 | 9 | 12 | 14 | 17 | 19 | 18 | 16 | 12 | 9 | 6 | 12 |
|---|
| Prec.(mm) | 75 | 60 | 55 | 40 | 55 | 60 | 60 | 65 | 65 | 80 | 65 | 75 | 755 |
|---|
| Prec. giorni | 14 | 12 | 12 | 10 | 11 | 12 | 11 | 12 | 12 | 14 | 13 | 14 | 147 |
|---|
| Umidità | 83% | 80% | 77% | 74% | 74% | 76% | 76% | 78% | 80% | 82% | 84% | 86% | 79% |
|---|
| Lungh. giorno | 7 | 10 | 12 | 14 | 17 | 18 | 17 | 15 | 13 | 10 | 8 | 7 | 12,3 |
|---|
| Ore sole | 1 | 3 | 4 | 5 | 6 | 5 | 4 | 4 | 4 | 3 | 2 | 1 | 1250 |
|---|
| Temp. mare | 8 | 8 | 7 | 8 | 9 | 11 | 13 | 14 | 13 | 12 | 11 | 10 | 10,4 |
|---|
Torna alle medie climatiche
Isola Di Man
Isola Di Man, posizione nella mappa
Isola Di Man - medie climatiche| Mese | Gen | Feb | Mar | Apr | Mag | Giu | Lug | Ago | Set | Ott | Nov | Dic | Anno |
|---|
| Temp.min | 5 | 4 | 4 | 6 | 8 | 11 | 12 | 13 | 11 | 9 | 7 | 5 | 7,9 |
|---|
| Temp.max | 8 | 8 | 9 | 11 | 14 | 17 | 18 | 18 | 16 | 14 | 11 | 9 | 12,9 |
|---|
| Prec.(mm) | 85 | 60 | 65 | 55 | 50 | 60 | 55 | 65 | 75 | 105 | 105 | 90 | 870 |
|---|
| Prec. giorni | 14 | 11 | 12 | 10 | 10 | 10 | 9 | 11 | 11 | 14 | 15 | 14 | 141 |
|---|
| Umidità | 80% | 80% | 80% | 78% | 77% | 80% | 81% | 82% | 81% | 80% | 80% | 80% | 80% |
|---|
| Lungh. giorno | 8 | 10 | 12 | 14 | 16 | 17 | 16 | 15 | 13 | 10 | 8 | 7 | 12,3 |
|---|
| Ore sole | 2 | 3 | 4 | 6 | 7 | 7 | 6 | 6 | 5 | 3 | 2 | 1 | 1590 |
|---|
| Temp. mare | 8 | 7 | 7 | 8 | 10 | 12 | 14 | 15 | 15 | 14 | 12 | 10 | 11 |
|---|
Torna alle medie climatiche
Jersey
Jersey, posizione nella mappa
Jersey - medie climatiche| Mese | Gen | Feb | Mar | Apr | Mag | Giu | Lug | Ago | Set | Ott | Nov | Dic | Anno |
|---|
| Temp.min | 5 | 4 | 5 | 7 | 9 | 12 | 14 | 14 | 13 | 11 | 8 | 5 | 9 |
|---|
| Temp.max | 9 | 9 | 11 | 13 | 16 | 19 | 20 | 21 | 19 | 16 | 12 | 10 | 14,4 |
|---|
| Prec.(mm) | 95 | 70 | 65 | 55 | 55 | 50 | 45 | 50 | 65 | 105 | 105 | 110 | 870 |
|---|
| Prec. giorni | 15 | 12 | 12 | 10 | 9 | 8 | 7 | 7 | 9 | 14 | 15 | 16 | 134 |
|---|
| Umidità | 86% | 84% | 82% | 80% | 80% | 81% | 81% | 81% | 80% | 82% | 83% | 85% | 82% |
|---|
| Lungh. giorno | 9 | 10 | 12 | 14 | 15 | 16 | 16 | 14 | 12 | 11 | 9 | 8 | 12,2 |
|---|
| Ore sole | 2 | 3 | 4 | 7 | 8 | 8 | 8 | 8 | 6 | 4 | 3 | 2 | 1905 |
|---|
| Temp. mare | 10 | 9 | 9 | 10 | 12 | 14 | 17 | 18 | 17 | 15 | 13 | 12 | 13 |
|---|
Torna alle medie climatiche
Kirkwall
Kirkwall, posizione nella mappa
Kirkwall - medie climatiche| Mese | Gen | Feb | Mar | Apr | Mag | Giu | Lug | Ago | Set | Ott | Nov | Dic | Anno |
|---|
| Temp.min | 2 | 2 | 3 | 4 | 6 | 8 | 10 | 11 | 9 | 7 | 4 | 3 | 5,8 |
|---|
| Temp.max | 7 | 7 | 8 | 10 | 12 | 14 | 16 | 16 | 14 | 12 | 9 | 7 | 11 |
|---|
| Prec.(mm) | 115 | 95 | 85 | 60 | 55 | 55 | 60 | 75 | 90 | 120 | 125 | 115 | 1050 |
|---|
| Prec. giorni | 20 | 18 | 17 | 14 | 12 | 11 | 12 | 13 | 15 | 19 | 20 | 20 | 191 |
|---|
| Umidità | 84% | 83% | 82% | 81% | 80% | 83% | 85% | 85% | 85% | 84% | 84% | 85% | 84% |
|---|
| Lungh. giorno | 7 | 9 | 12 | 15 | 17 | 18 | 18 | 15 | 13 | 10 | 8 | 6 | 12,3 |
|---|
| Ore sole | 1 | 2 | 3 | 5 | 6 | 5 | 4 | 4 | 4 | 2 | 1 | 1 | 1210 |
|---|
| Temp. mare | 8 | 8 | 7 | 7 | 9 | 11 | 13 | 13 | 13 | 12 | 11 | 10 | 10 |
|---|
Torna alle medie climatiche
Lerwick
Lerwick, posizione nella mappa
Lerwick - medie climatiche| Mese | Gen | Feb | Mar | Apr | Mag | Giu | Lug | Ago | Set | Ott | Nov | Dic | Anno |
|---|
| Temp.min | 2 | 2 | 2 | 4 | 6 | 8 | 10 | 10 | 9 | 7 | 4 | 2 | 5,6 |
|---|
| Temp.max | 6 | 6 | 7 | 8 | 11 | 13 | 14 | 15 | 13 | 10 | 8 | 7 | 9,8 |
|---|
| Prec.(mm) | 150 | 125 | 110 | 70 | 55 | 60 | 70 | 90 | 105 | 130 | 145 | 150 | 1260 |
|---|
| Prec. giorni | 22 | 19 | 19 | 15 | 12 | 12 | 12 | 13 | 16 | 20 | 22 | 23 | 205 |
|---|
| Umidità | 83% | 83% | 81% | 80% | 80% | 82% | 85% | 86% | 84% | 84% | 83% | 83% | 83% |
|---|
| Lungh. giorno | 7 | 9 | 12 | 15 | 17 | 19 | 18 | 16 | 13 | 10 | 7 | 6 | 12,4 |
|---|
| Ore sole | 1 | 2 | 3 | 5 | 6 | 5 | 4 | 4 | 3 | 2 | 1 | 1 | 1160 |
|---|
| Temp. mare | 8 | 8 | 8 | 8 | 9 | 10 | 12 | 13 | 12 | 11 | 10 | 9 | 9,9 |
|---|
Torna alle medie climatiche
Liverpool
Liverpool, posizione nella mappa
Liverpool - medie climatiche| Mese | Gen | Feb | Mar | Apr | Mag | Giu | Lug | Ago | Set | Ott | Nov | Dic | Anno |
|---|
| Temp.min | 3 | 3 | 4 | 6 | 8 | 11 | 13 | 13 | 11 | 8 | 6 | 3 | 7,5 |
|---|
| Temp.max | 8 | 8 | 10 | 13 | 16 | 19 | 20 | 20 | 18 | 14 | 10 | 8 | 13,7 |
|---|
| Prec.(mm) | 75 | 55 | 65 | 55 | 55 | 65 | 60 | 70 | 70 | 95 | 85 | 90 | 840 |
|---|
| Prec. giorni | 14 | 11 | 13 | 10 | 11 | 11 | 10 | 11 | 12 | 15 | 15 | 14 | 147 |
|---|
| Umidità | 83% | 80% | 76% | 73% | 71% | 73% | 73% | 75% | 77% | 80% | 83% | 84% | 77% |
|---|
| Lungh. giorno | 8 | 10 | 12 | 14 | 16 | 17 | 16 | 15 | 13 | 10 | 9 | 8 | 12,3 |
|---|
| Ore sole | 2 | 3 | 3 | 5 | 7 | 6 | 6 | 6 | 4 | 3 | 2 | 2 | 1500 |
|---|
| Temp. mare | 8 | 7 | 7 | 8 | 10 | 12 | 14 | 15 | 15 | 13 | 12 | 10 | 11 |
|---|
Torna alle medie climatiche
Londra
Londra, posizione nella mappa
Londra - medie climatiche| Mese | Gen | Feb | Mar | Apr | Mag | Giu | Lug | Ago | Set | Ott | Nov | Dic | Anno |
|---|
| Temp.min | 3 | 3 | 4 | 6 | 9 | 12 | 14 | 14 | 12 | 9 | 5 | 3 | 7,8 |
|---|
| Temp.max | 8 | 9 | 12 | 15 | 18 | 22 | 24 | 23 | 20 | 16 | 11 | 9 | 15,6 |
|---|
| Prec.(mm) | 60 | 45 | 40 | 40 | 45 | 45 | 45 | 55 | 50 | 65 | 65 | 55 | 610 |
|---|
| Prec. giorni | 12 | 10 | 8 | 9 | 8 | 8 | 8 | 8 | 8 | 11 | 11 | 11 | 112 |
|---|
| Umidità | 83% | 79% | 74% | 70% | 68% | 67% | 66% | 69% | 74% | 80% | 84% | 85% | 75% |
|---|
| Lungh. giorno | 8 | 10 | 12 | 14 | 16 | 17 | 16 | 14 | 13 | 11 | 9 | 8 | 12,3 |
|---|
| Ore sole | 2 | 3 | 4 | 6 | 7 | 7 | 7 | 7 | 5 | 4 | 2 | 2 | 1675 |
|---|
Torna alle medie climatiche
Manchester
Manchester, posizione nella mappa
Manchester - medie climatiche| Mese | Gen | Feb | Mar | Apr | Mag | Giu | Lug | Ago | Set | Ott | Nov | Dic | Anno |
|---|
| Temp.min | 2 | 2 | 3 | 5 | 7 | 10 | 12 | 12 | 10 | 7 | 4 | 2 | 6,4 |
|---|
| Temp.max | 7 | 8 | 10 | 13 | 16 | 19 | 21 | 20 | 18 | 14 | 10 | 7 | 13,6 |
|---|
| Prec.(mm) | 70 | 50 | 60 | 55 | 55 | 65 | 65 | 75 | 70 | 95 | 80 | 80 | 820 |
|---|
| Prec. giorni | 13 | 10 | 12 | 11 | 10 | 11 | 11 | 12 | 11 | 14 | 14 | 14 | 143 |
|---|
| Umidità | 84% | 81% | 76% | 73% | 71% | 73% | 74% | 76% | 79% | 83% | 86% | 86% | 79% |
|---|
| Lungh. giorno | 8 | 10 | 12 | 14 | 16 | 17 | 16 | 15 | 13 | 10 | 9 | 8 | 12,3 |
|---|
| Ore sole | 2 | 3 | 3 | 5 | 6 | 6 | 6 | 5 | 4 | 3 | 2 | 2 | 1415 |
|---|
Torna alle medie climatiche
Newcastle
Newcastle, posizione nella mappa
Newcastle - medie climatiche| Mese | Gen | Feb | Mar | Apr | Mag | Giu | Lug | Ago | Set | Ott | Nov | Dic | Anno |
|---|
| Temp.min | 2 | 2 | 2 | 4 | 6 | 9 | 11 | 11 | 9 | 6 | 4 | 2 | 5,5 |
|---|
| Temp.max | 6 | 7 | 9 | 11 | 14 | 17 | 19 | 19 | 17 | 13 | 9 | 7 | 12,4 |
|---|
| Prec.(mm) | 50 | 40 | 45 | 55 | 45 | 55 | 55 | 60 | 55 | 60 | 70 | 55 | 645 |
|---|
| Prec. giorni | 11 | 9 | 10 | 10 | 9 | 10 | 9 | 10 | 9 | 11 | 12 | 12 | 122 |
|---|
| Umidità | 85% | 82% | 79% | 78% | 76% | 77% | 78% | 79% | 82% | 84% | 87% | 87% | 81% |
|---|
| Lungh. giorno | 8 | 10 | 12 | 14 | 16 | 17 | 16 | 15 | 13 | 10 | 8 | 7 | 12,3 |
|---|
| Ore sole | 2 | 3 | 4 | 5 | 6 | 5 | 6 | 5 | 4 | 3 | 2 | 2 | 1445 |
|---|
| Temp. mare | 7 | 6 | 6 | 7 | 9 | 12 | 14 | 15 | 14 | 12 | 10 | 8 | 10,2 |
|---|
Torna alle medie climatiche
Norwich
Norwich, posizione nella mappa
Norwich - medie climatiche| Mese | Gen | Feb | Mar | Apr | Mag | Giu | Lug | Ago | Set | Ott | Nov | Dic | Anno |
|---|
| Temp.min | 3 | 3 | 4 | 5 | 8 | 11 | 13 | 13 | 11 | 8 | 5 | 3 | 7,2 |
|---|
| Temp.max | 8 | 8 | 10 | 13 | 16 | 19 | 22 | 22 | 19 | 15 | 11 | 8 | 14,2 |
|---|
| Prec.(mm) | 55 | 40 | 50 | 45 | 45 | 60 | 55 | 65 | 60 | 70 | 70 | 60 | 675 |
|---|
| Prec. giorni | 12 | 10 | 11 | 9 | 9 | 10 | 9 | 9 | 10 | 11 | 12 | 12 | 124 |
|---|
| Umidità | 86% | 82% | 79% | 75% | 74% | 74% | 73% | 74% | 79% | 83% | 87% | 87% | 79% |
|---|
| Lungh. giorno | 8 | 10 | 12 | 14 | 16 | 17 | 16 | 15 | 13 | 10 | 9 | 8 | 12,3 |
|---|
| Ore sole | 2 | 3 | 4 | 6 | 7 | 6 | 7 | 6 | 5 | 4 | 2 | 2 | 1610 |
|---|
Torna alle medie climatiche
Plymouth
Plymouth, posizione nella mappa
Plymouth - medie climatiche| Mese | Gen | Feb | Mar | Apr | Mag | Giu | Lug | Ago | Set | Ott | Nov | Dic | Anno |
|---|
| Temp.min | 4 | 4 | 5 | 6 | 9 | 11 | 13 | 13 | 11 | 9 | 7 | 5 | 8,1 |
|---|
| Temp.max | 9 | 9 | 11 | 13 | 16 | 18 | 20 | 20 | 18 | 15 | 12 | 10 | 14,2 |
|---|
| Prec.(mm) | 110 | 90 | 75 | 70 | 60 | 65 | 65 | 80 | 70 | 110 | 120 | 125 | 1040 |
|---|
| Prec. giorni | 15 | 13 | 12 | 11 | 10 | 10 | 10 | 11 | 10 | 15 | 16 | 16 | 149 |
|---|
| Umidità | 86% | 84% | 82% | 80% | 80% | 81% | 83% | 84% | 84% | 85% | 86% | 86% | 84% |
|---|
| Lungh. giorno | 9 | 10 | 12 | 14 | 16 | 16 | 16 | 14 | 12 | 11 | 9 | 8 | 12,3 |
|---|
| Ore sole | 2 | 3 | 4 | 6 | 7 | 7 | 7 | 6 | 5 | 4 | 2 | 2 | 1735 |
|---|
| Temp. mare | 10 | 9 | 9 | 10 | 11 | 14 | 16 | 17 | 16 | 15 | 13 | 12 | 12,6 |
|---|
Torna alle medie climatiche
Scilly
Scilly, posizione nella mappa
Scilly - medie climatiche| Mese | Gen | Feb | Mar | Apr | Mag | Giu | Lug | Ago | Set | Ott | Nov | Dic | Anno |
|---|
| Temp.min | 6 | 6 | 7 | 8 | 10 | 12 | 14 | 14 | 13 | 11 | 9 | 7 | 9,7 |
|---|
| Temp.max | 10 | 10 | 11 | 13 | 15 | 17 | 19 | 20 | 18 | 15 | 12 | 11 | 14,2 |
|---|
| Prec.(mm) | 95 | 75 | 55 | 50 | 50 | 50 | 70 | 75 | 70 | 90 | 100 | 100 | 880 |
|---|
| Prec. giorni | 15 | 13 | 12 | 10 | 9 | 9 | 9 | 10 | 10 | 14 | 16 | 16 | 143 |
|---|
| Lungh. giorno | 9 | 10 | 12 | 14 | 16 | 16 | 16 | 14 | 12 | 11 | 9 | 8 | 12,2 |
|---|
| Ore sole | 2 | 3 | 4 | 7 | 7 | 7 | 7 | 6 | 6 | 4 | 2 | 2 | 1710 |
|---|
| Temp. mare | 11 | 10 | 10 | 11 | 12 | 14 | 16 | 17 | 17 | 15 | 13 | 12 | 13,2 |
|---|
Torna alle medie climatiche
Stornoway
Stornoway, posizione nella mappa
Stornoway - medie climatiche| Mese | Gen | Feb | Mar | Apr | Mag | Giu | Lug | Ago | Set | Ott | Nov | Dic | Anno |
|---|
| Temp.min | 3 | 2 | 3 | 5 | 6 | 9 | 11 | 11 | 9 | 7 | 5 | 3 | 6,2 |
|---|
| Temp.max | 7 | 8 | 8 | 10 | 13 | 14 | 16 | 16 | 15 | 12 | 10 | 8 | 11,5 |
|---|
| Prec.(mm) | 145 | 110 | 105 | 75 | 70 | 65 | 75 | 90 | 105 | 135 | 130 | 140 | 1245 |
|---|
| Prec. giorni | 21 | 18 | 18 | 15 | 14 | 13 | 14 | 15 | 16 | 20 | 21 | 21 | 206 |
|---|
| Umidità | 84% | 82% | 82% | 80% | 79% | 81% | 83% | 84% | 84% | 83% | 83% | 84% | 82% |
|---|
| Lungh. giorno | 7 | 9 | 12 | 14 | 17 | 18 | 17 | 15 | 13 | 10 | 8 | 6 | 12,3 |
|---|
| Ore sole | 1 | 2 | 3 | 5 | 7 | 5 | 4 | 4 | 4 | 3 | 1 | 1 | 1255 |
|---|
| Temp. mare | 8 | 8 | 7 | 7 | 9 | 11 | 13 | 13 | 13 | 12 | 11 | 10 | 10 |
|---|
Torna alle medie climatiche
Swansea
Swansea, posizione nella mappa
Swansea - medie climatiche| Mese | Gen | Feb | Mar | Apr | Mag | Giu | Lug | Ago | Set | Ott | Nov | Dic | Anno |
|---|
| Temp.min | 4 | 4 | 5 | 7 | 10 | 12 | 14 | 14 | 13 | 10 | 7 | 5 | 8,8 |
|---|
| Temp.max | 8 | 8 | 10 | 12 | 15 | 18 | 20 | 20 | 18 | 15 | 12 | 9 | 13,7 |
|---|
| Prec.(mm) | 105 | 75 | 70 | 60 | 65 | 70 | 75 | 90 | 75 | 115 | 120 | 115 | 1035 |
|---|
| Prec. giorni | 16 | 12 | 13 | 11 | 10 | 10 | 10 | 12 | 11 | 15 | 16 | 16 | 152 |
|---|
| Temp. mare | 10 | 9 | 9 | 10 | 11 | 13 | 15 | 16 | 16 | 15 | 13 | 12 | 12,5 |
|---|
Torna alle medie climatiche
Valley
Valley, posizione nella mappa
Valley - medie climatiche| Mese | Gen | Feb | Mar | Apr | Mag | Giu | Lug | Ago | Set | Ott | Nov | Dic | Anno |
|---|
| Temp.min | 4 | 4 | 4 | 6 | 9 | 11 | 13 | 13 | 12 | 9 | 7 | 4 | 7,9 |
|---|
| Temp.max | 8 | 8 | 10 | 12 | 15 | 17 | 19 | 19 | 17 | 14 | 11 | 9 | 13,4 |
|---|
| Prec.(mm) | 75 | 60 | 55 | 55 | 50 | 55 | 55 | 70 | 75 | 100 | 105 | 95 | 850 |
|---|
| Prec. giorni | 14 | 12 | 11 | 11 | 9 | 9 | 10 | 11 | 11 | 14 | 16 | 16 | 144 |
|---|
| Ore sole | 2 | 3 | 4 | 6 | 8 | 7 | 7 | 6 | 5 | 3 | 2 | 2 | 1675 |
|---|
Torna alle medie climatiche
Vyrnwy (360 m.)
Vyrnwy, posizione nella mappa
Vyrnwy - medie climatiche| Mese | Gen | Feb | Mar | Apr | Mag | Giu | Lug | Ago | Set | Ott | Nov | Dic | Anno |
|---|
| Temp.min | 1 | 1 | 2 | 4 | 6 | 9 | 11 | 11 | 9 | 7 | 4 | 2 | 5,5 |
|---|
| Temp.max | 6 | 6 | 8 | 11 | 14 | 16 | 18 | 18 | 15 | 12 | 8 | 6 | 11,4 |
|---|
| Prec.(mm) | 190 | 165 | 125 | 95 | 100 | 100 | 100 | 110 | 120 | 180 | 180 | 215 | 1680 |
|---|
| Prec. giorni | 18 | 15 | 15 | 13 | 13 | 13 | 14 | 15 | 14 | 17 | 19 | 19 | 185 |
|---|
| Ore sole | 1 | 2 | 3 | 5 | 6 | 5 | 5 | 5 | 4 | 3 | 2 | 1 | 1310 |
|---|
Torna alle medie climatiche